asked 82.0k views
2 votes
Which is the graph of the linear inequality 2x – 3y < 12?

On a coordinate plane, a solid straight line has a positive slope and goes through (0, negative 4) and (3, negative 2). Everything to the right of the line is shaded.

On a coordinate plane, a dashed straight line has a positive slope and goes through (0, negative 4) and (3, negative 2). Everything to the right of the line is shaded.

On a coordinate plane, a dashed straight line has a positive slope and goes through (0, negative 4) and (3, negative 2). Everything to the left of the line is shaded.

On a coordinate plane, a solid straight line has a positive slope and goes through (0, negative 4) and (3, negative 2). Everything to the left of the line is shaded.

2 Answers

6 votes

Answer:

b

Explanation:

answered
User Cproinger
by
8.4k points
3 votes

Answer:

On a coordinate plane, a dashed straight line has a positive slope and goes through (0, negative 4) and (3, negative 2). Everything to the left of the line is shaded.

Explanation:

1) This is our inequality:


2x-3y<12

2) Since its first member is lesser than we'll trace a dashed line for the left side is not included.

3) The slope is the parameter that follow the x variable, in this case 2.

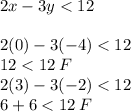
4) Plugging the points. To verify:


2x-3y<12


2x-3y<12\\\\2(0)-3(-4)<12\\12<12 \:F\\2(3) -3(-2)<12\\6+6<12 \: F

These points do not belong to the inequality, so the dashed line pass through these points.

Then it's

On a coordinate plane, a dashed straight line has a positive slope and goes through (0, negative 4) and (3, negative 2). Everything to the left of the line is shaded.

Which is the graph of the linear inequality 2x – 3y < 12? On a coordinate plane-example-1
answered
User Narendra
by
8.3k points

No related questions found

Welcome to Qamnty — a place to ask, share, and grow together. Join our community and get real answers from real people.